
For the second year running, here are the 20 (+1) best charts to describe the current situation in the eurozone economy. As always, the charts are original works (albeit inspired by a certain “Danske Bank” visual style) using data from either Eurostat or the ECB.
A picture is worth a thousand words, they say.
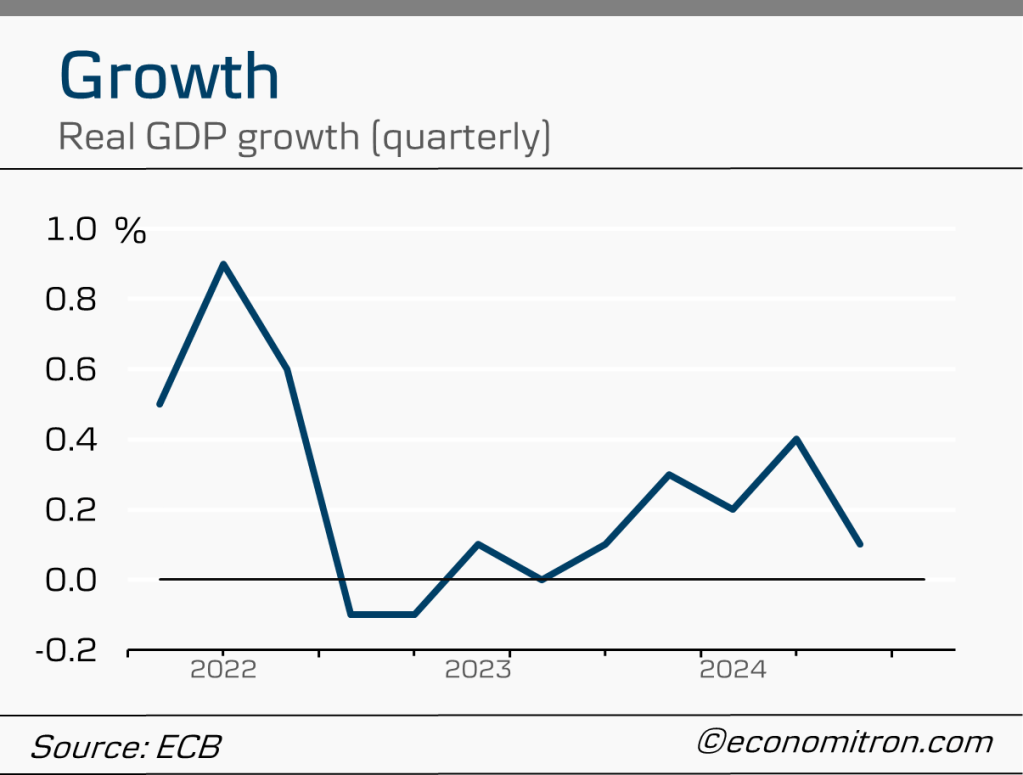
Growth
Growth in the eurozone was marginally better in 2024 than in 2023, having picked up thanks to recovering economic prospects, stronger global demand for exports and fading effects of restrictive financial conditions. Despite this, several structural weaknesses still exert a drag on output, notably concerning below-average manufacturing production.
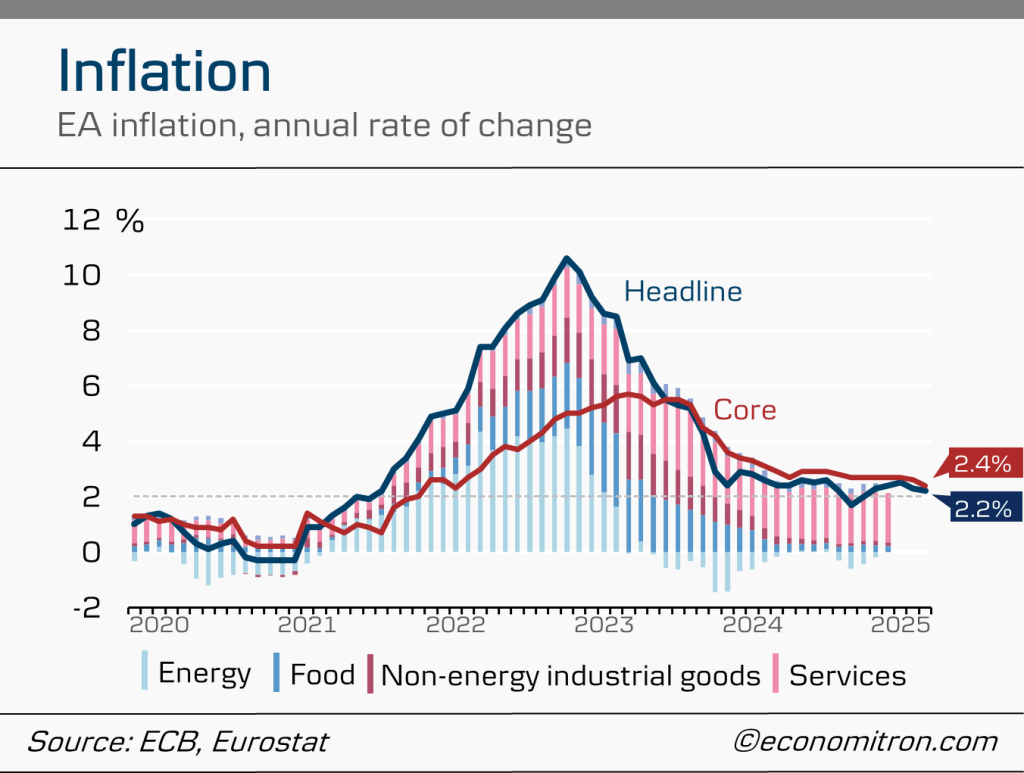
Inflation
Inflation is slowly creeping towards the ECB’s 2% medium-term target, with price developments in March pointing to a 2.2% annualised increase in prices. Core inflation, which excludes volatile elements such as energy and food (thus providing a more accurate image of underlying inflation dynamics), is still higher at 2.4%.
Higher core inflation figures can be attributed to deflating energy prices. Notably, services inflation fell considerably in March. As services have remained the biggest contributor to headline inflation, continuously decelerating services inflation is crucial for the disinflationary process.
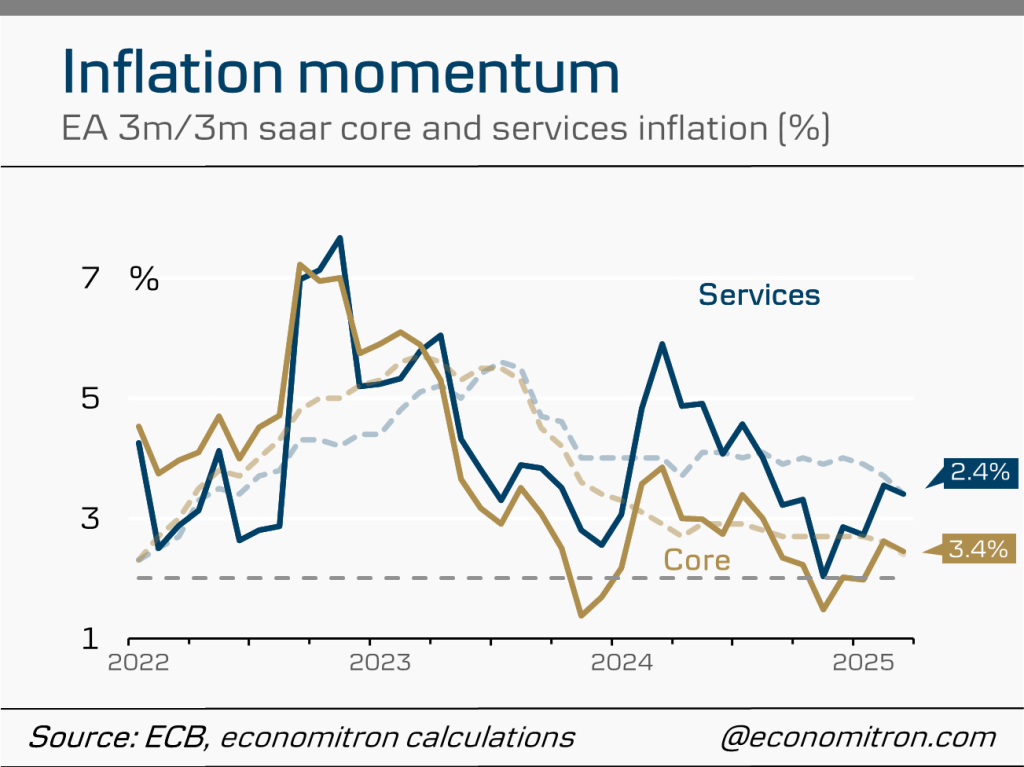
Indeed, services inflation momentum is cooling off. This is shown by the 3 month-on-3 month rate, which (simply put) compares the rate of change of prices for every quarter rather than for an entire year. This gives a more accurate image of the short-term direction of inflation. A slight uptick in the beginning of the year can be expected due to negotiated wage agreements materialising in January.
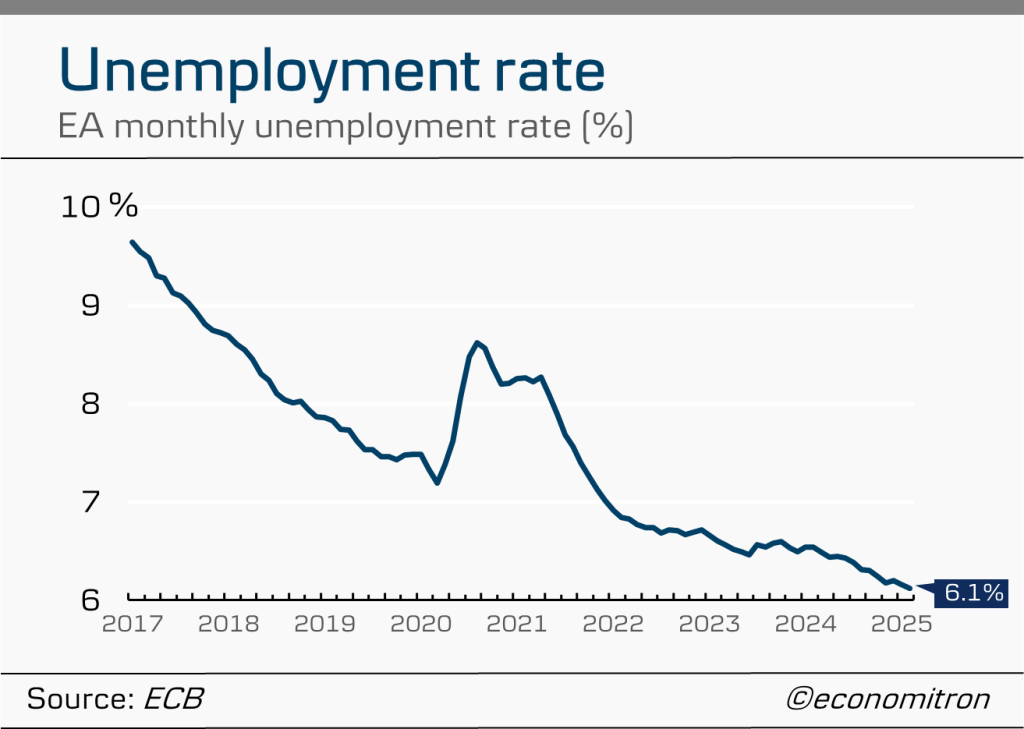
Labour Market
The labour market remains resilient, with multiple indicators pointing to moderating pressures. Although the unemployment rate has fallen to its record low of 6.1%, employment growth has persistently decelerated in the past years.

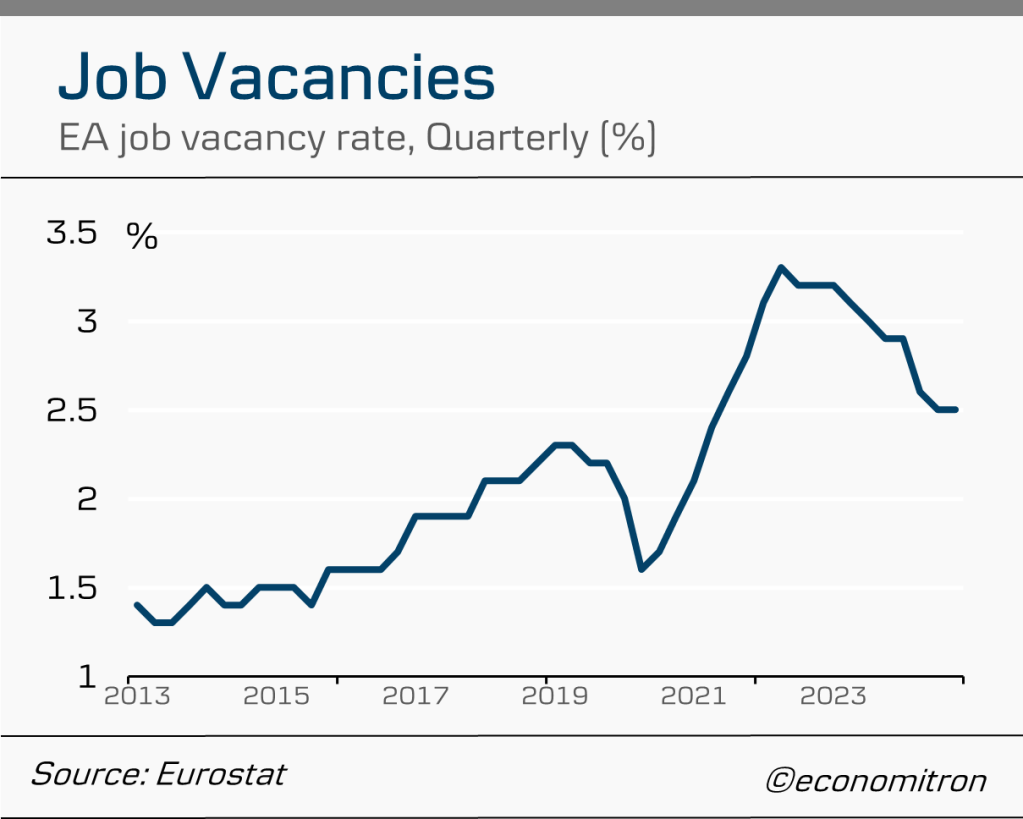
Weakening demand has been further reflected by falling job vacancies, which stood at 2.5% in Q4. This is down from over 3% at the peak of the tightness as firms’ demand for labour recedes. Diminishing job vacancies are a crucial sign of easing labour market tensions, as labour shortages are key instigators of labour hoarding and hence tightness.
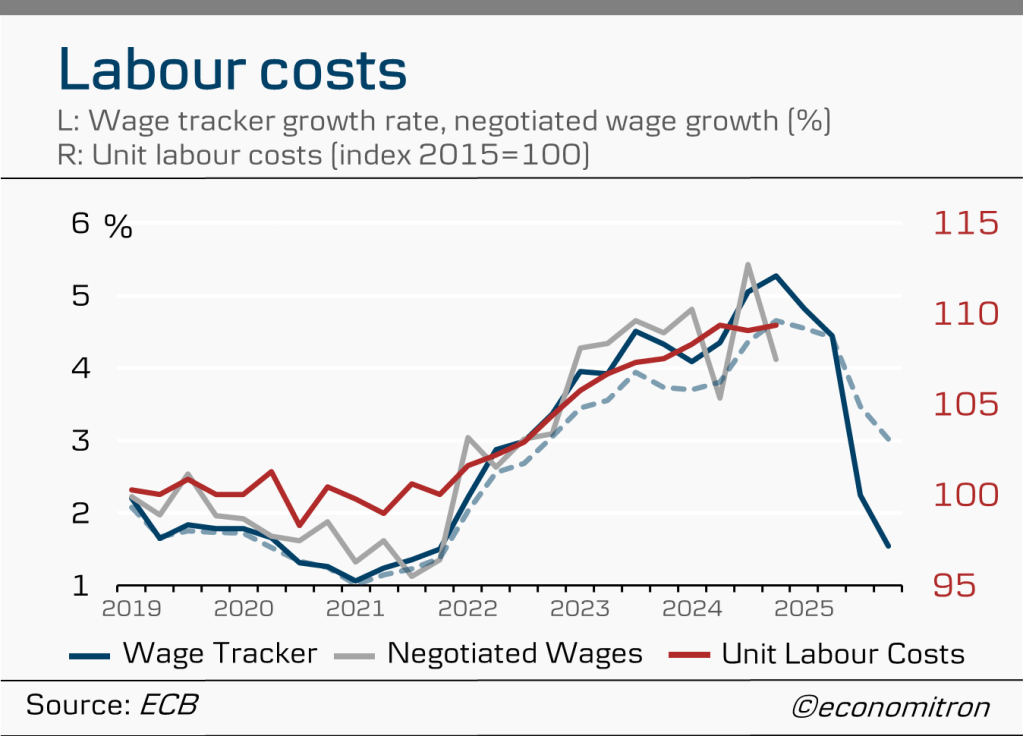
Accordingly, as labour market tightness subsides, labour costs are also tapering down, mainly being driven by the lagging effects of previous inflation episodes. The ECB’s wage tracker excluding one-off payments such as indexation or back-dated pay (shown by the dotted line) currently stands half a percentage point below the headline tracker. This indicates that underlying headwind pressures on services inflation are easing. This is mirrored by both the rate of growth of negotiated wages (which are a component of the wage tracker) and the unit labour cost index seemingly having hit their peak.
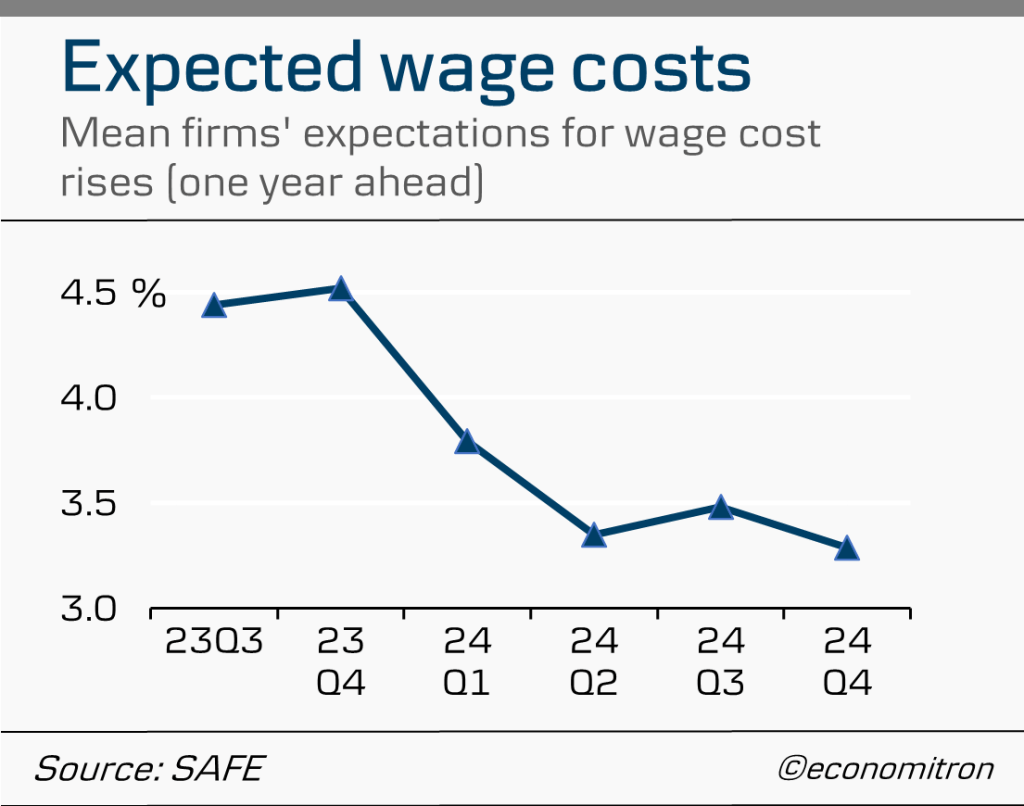
Going forward, wage pressures are expected to moderate as inflationary effects fade. Firms’ average expectations for future wage costs are receding, with an average expectation of 3.3% rise in the upcoming year. This is compared to 4.5% twelve months ago.
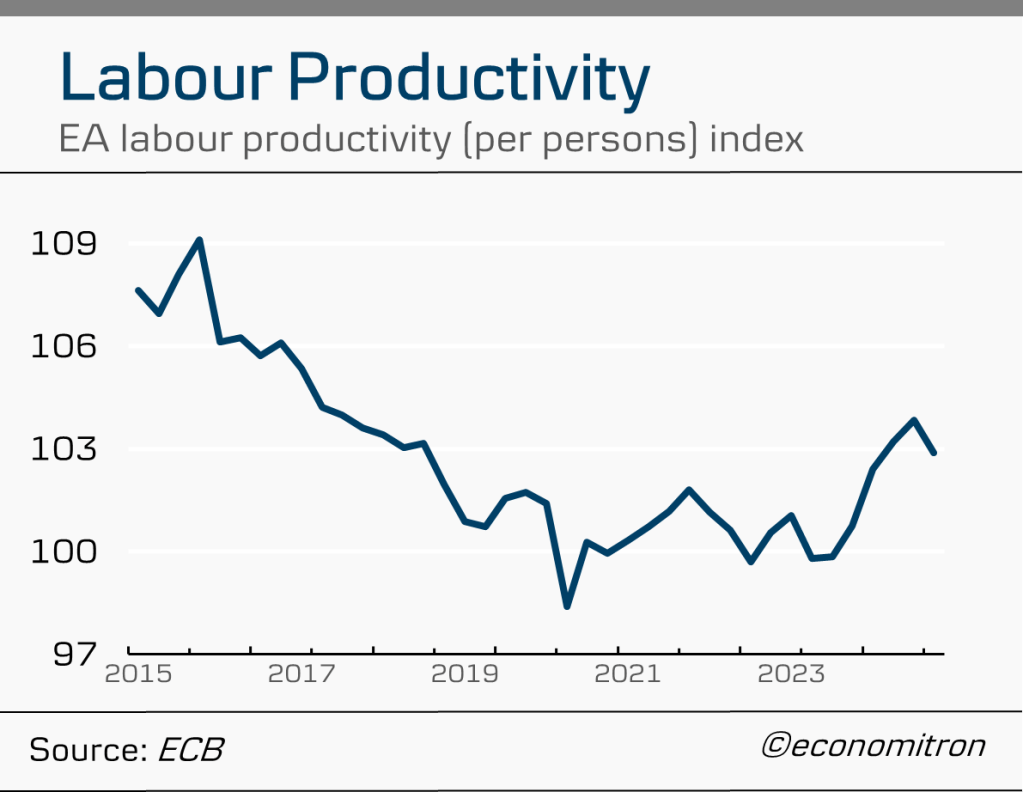
Recovering economic prospects also assist the gradual improvement of labour productivity figures, which are up from a slump. A cyclical recovery in productivity figures will diminish the contribution of unit labour costs, and provide further tailwinds for services disinflation.
Confidence
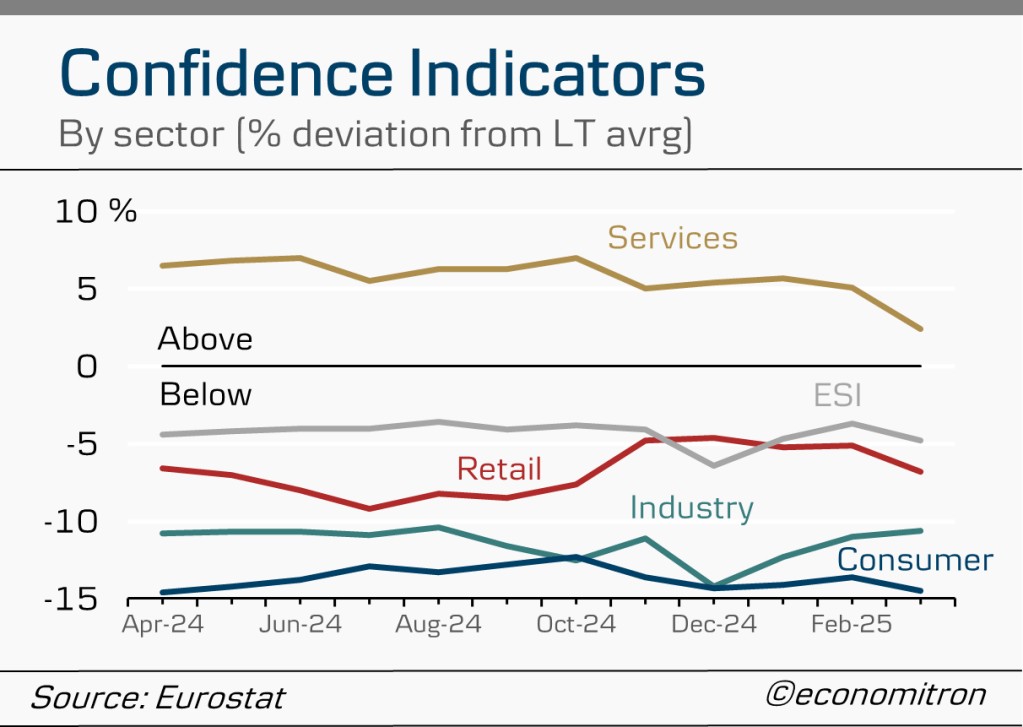
Economic prospects remain below the long-term average, although improvements are expected with recovering economic activity. The services industry remained one of the few bright spots, being resilient due to its labour-intensive nature.
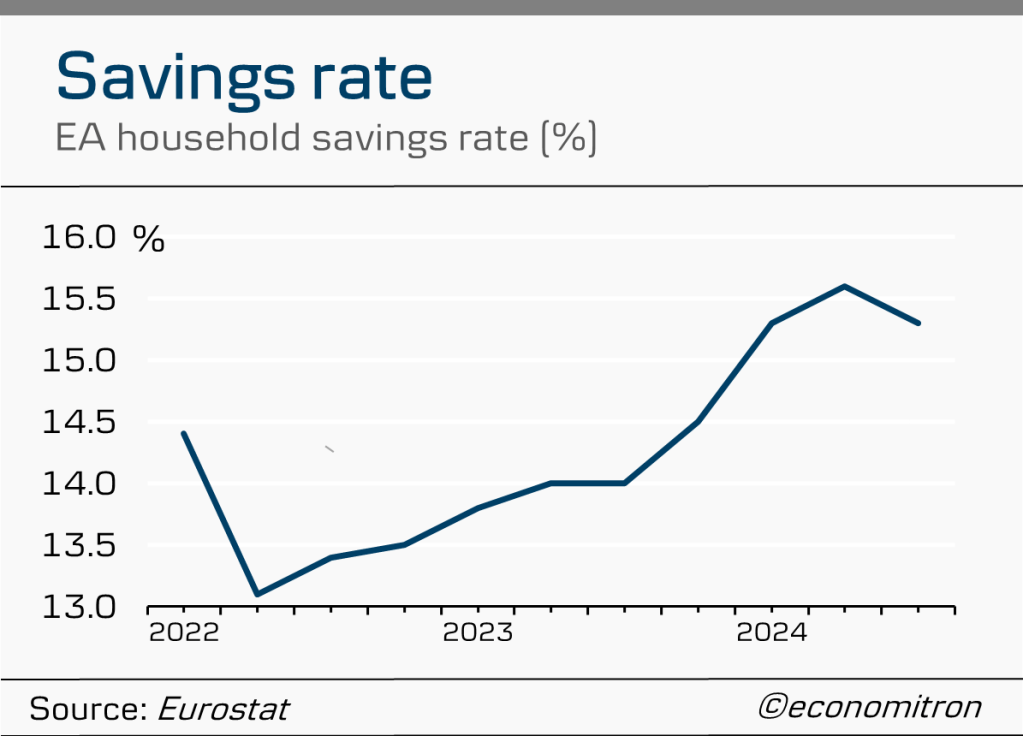
Very few gripes about the state of spending and investment in Europe (as compared to other trading partners such as the US) are summarised quite as well as by the elevated savings rate of eurozone households. Despite easing financing conditions, it still stands well over 2 percentage points above the pre-pandemic average of 12.9%. Consumer confidence remains gloomy.
And, although inflation expectations remained anchored during the hikes of 2023, more and more people are starting to believe that the short-term direction of inflation is up, not down. Anchoring inflation expectations is crucial, as an expectation for inflation turns into a self-fulfilling prophecy as soon as people begin pre-emping their purchase decisions and asking for more wage increases. It could be the case that there is a slight confusion between the idea of prices increasing at an increasing or decreasing rate.

Credit, monetary and financial conditions
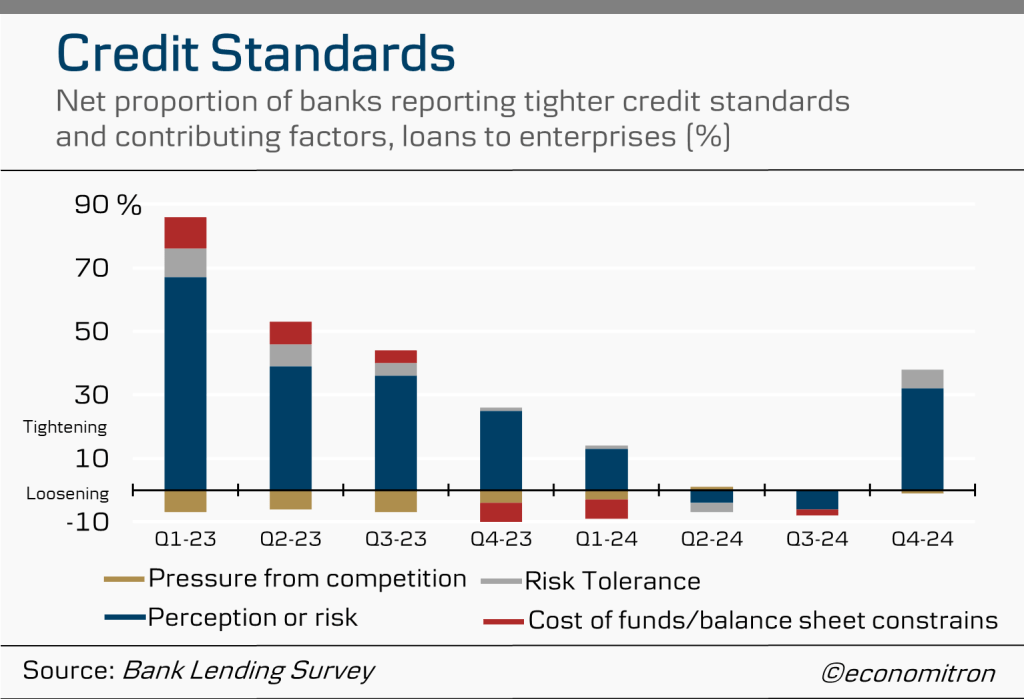
Coming from a two-year tightening period, financing conditions have been easing. However, both credit standards for loans to enterprises and consumers tightened in the fourth quarter of 2024, as reported by the latest Bank Lending Survey. Risk perceptions due to the economic outlook and borrowers’ creditworthiness were the leading contributor in tighter credit standards, with a net 38% of banks citing concerns over risk in loans to enterprises.
Net demand for loans has begun showing signs of increasing. For the first time since 2021, in the third quarter of 2024, the general level of interest rates resulted in a net increase in demand for consumer credit. Nevertheless, despite stronger demand, tight credit standards have kept the growth rate of loans stable.

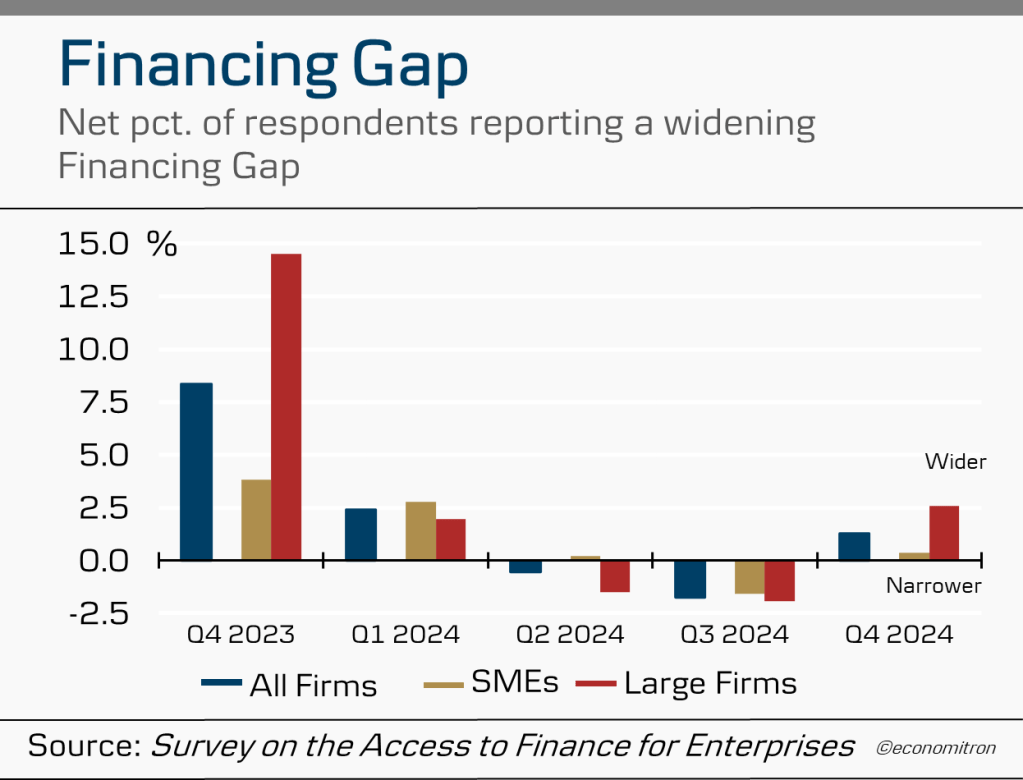
A narrower financing gap (the smaller difference between firms’ liquidity needs and what they are able to receive) also indicated diminishing credit standards from banks in 2024.
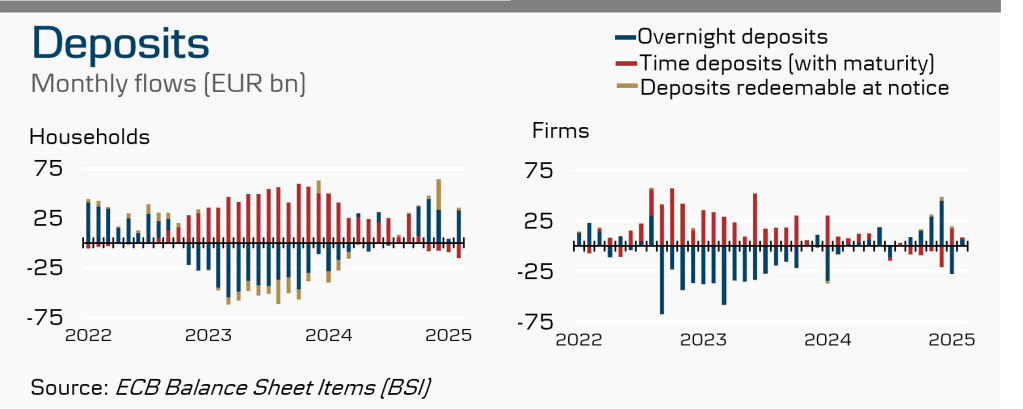
As for monetary conditions, people are starting to expect economic activity. This is shown by the shift in deposits from long-term deposits to more liquid overnight deposits.
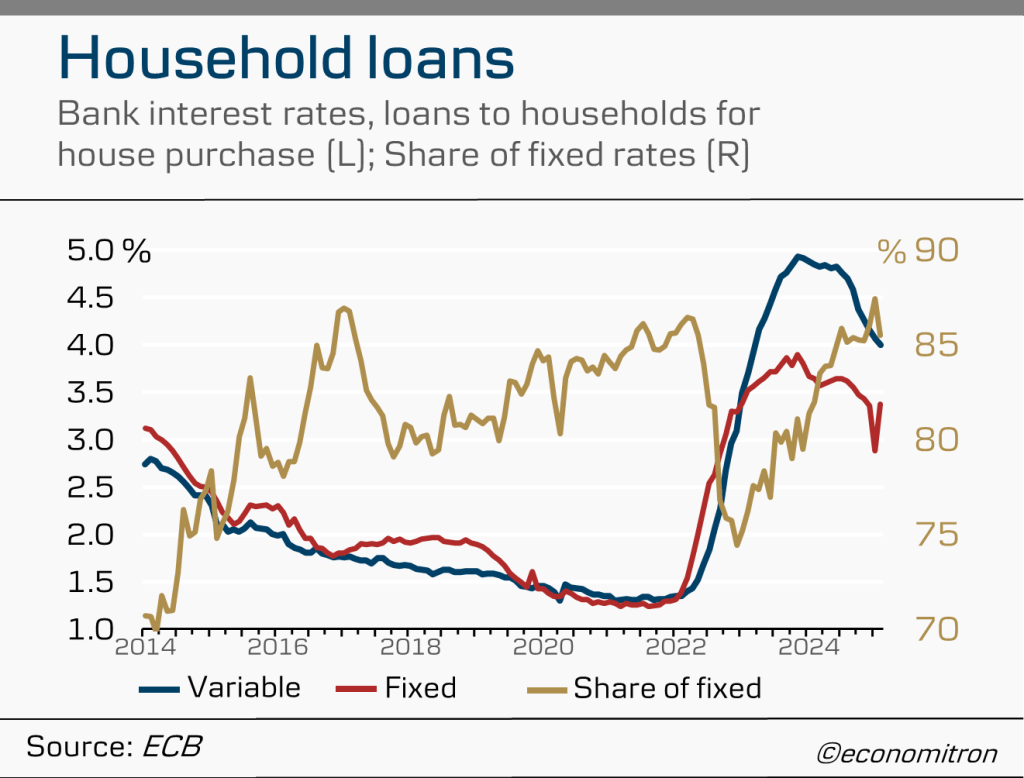
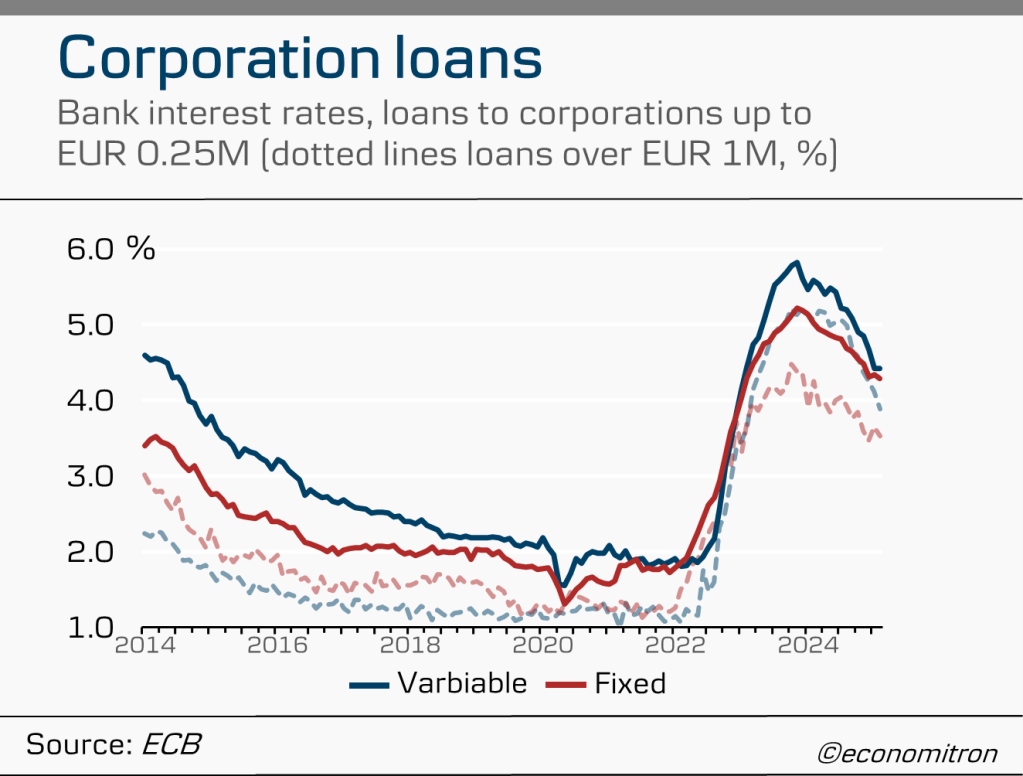
Strong monetary policy passthrough is also shown by excellent bank profitability during the last hiking cycle, where higher interest rates translated to banks increasing their loan rates. It is also indicative of lower-than-expected passthrough of higher interest rates on deposits (cheeky banks).

Indeed, bank interest rates are coming off their peak, with variable rates still trending above long-term fixed rates. Those stuck with fixed rate debt will be looking at high debt financing costs as the easing cycle continues: the question is just how low variable rates will go, as they were far quicker in going up than going down now.
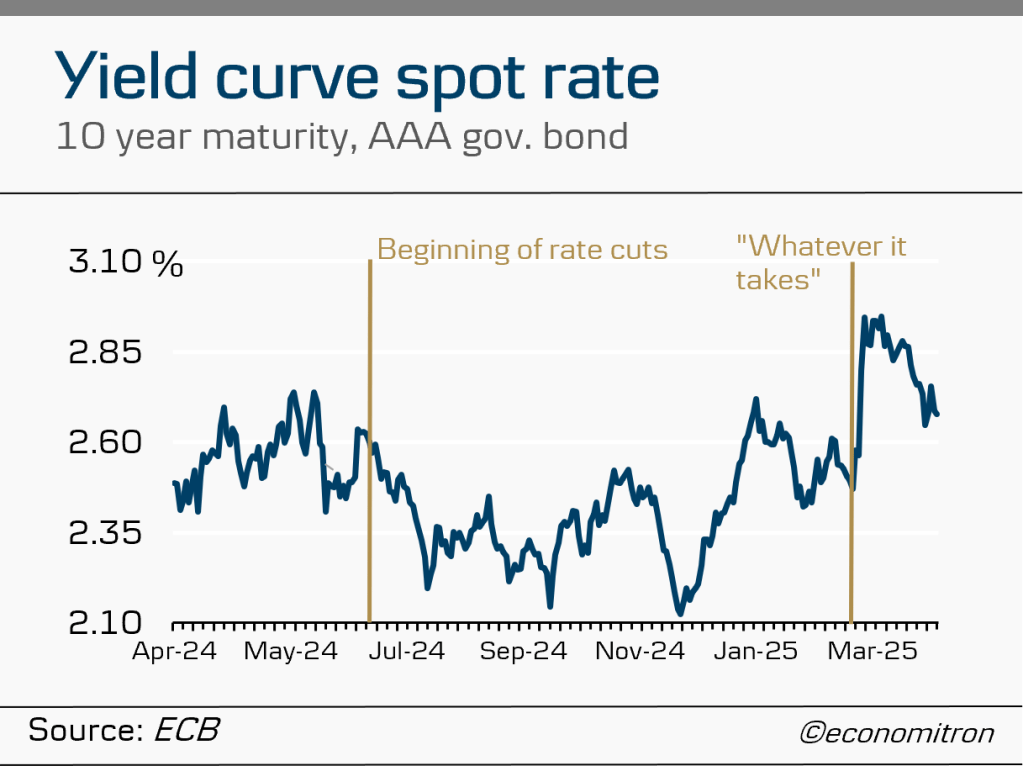
It is also interesting to note that yields on government bonds are also going up, being driven up significantly by recent infrastructure and defence spending plans by Germany’s new chancellor. This topic deserves its own blog post.
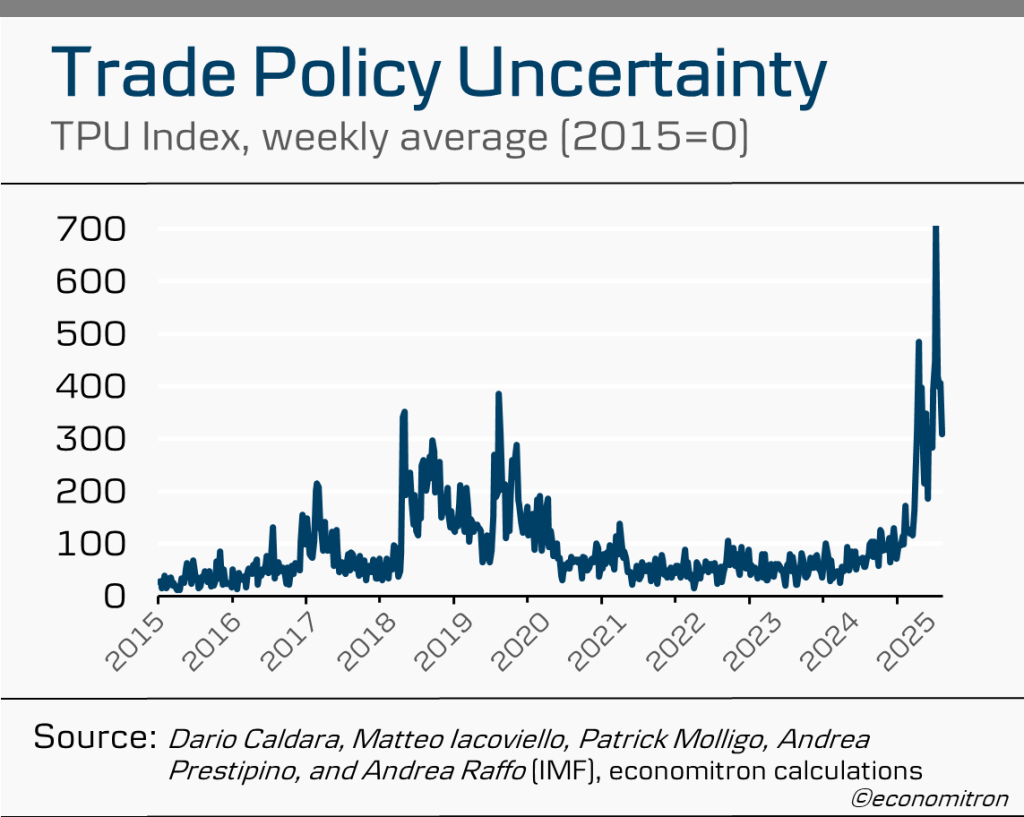
Last but (definitely) not least
One word that trumps all others in describing the current economic situation not only in Europe but in the entire world is uncertainty. Be it defence spending, costs of the green transition or unnecessary meddling with the well-established fabric of world trade, uncertainty about the future clouds investors’, central bankers’ and everyday consumers’ decisions. Whilst the previous 20 charts gave a clear picture of the current euro area economy, what the future holds is far less certain.

Leave a comment