
This post will be short and sweet. The current situation emanating from the Middle East has already been characterised as the “most severe oil supply shock in history” (IEA). Even if the situation calms down, the untold amount of capital destruction will cause years of delays as the world’s oil production recovers. Given a not-so-distant memory of a conflict-induced energy shock that caused historic levels of inflation, it’s no wonder that policymakers are on edge now.
Energy shocks are usually transitory but painful. Supply chain diversification and resilience typically mean that small shocks come and go, but that doesn’t stop them from temporarily inflicting wounds on all aspects of modern economies. The problem comes when the shock does not come and go, reflecting instead a fundamental shift in the baseline. Such was the case with Ukraine in 2022. Such may be the case now.
The plots below paint an empirical relationship between changes in Brent crude (left) or benchmark European gas prices and eurozone energy inflation since 2011. The darkening lines calculate a simple linear regression for the 50%, 75% and 90% percentiles of year-on-year energy price increases, respectively. In other words, the darkest blue line depicts the best-fit line between energy inflation and the top 10% of Brent price increases.
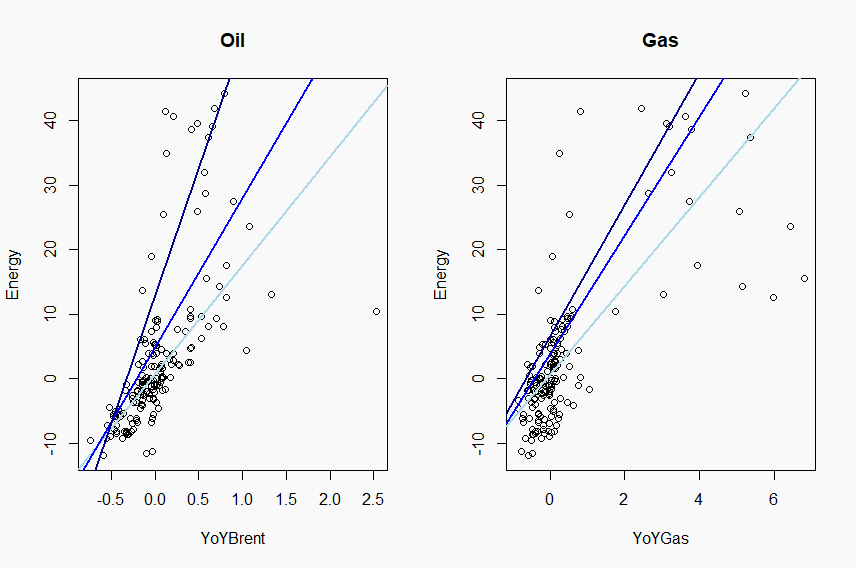
As shown by the steepening slope, higher shocks are linked to even larger jumps in energy inflation. This is especially pronounced for oil shocks. Hence they exhibit visible non-linearities. This is presumably a reflection of their lack of transitivity.
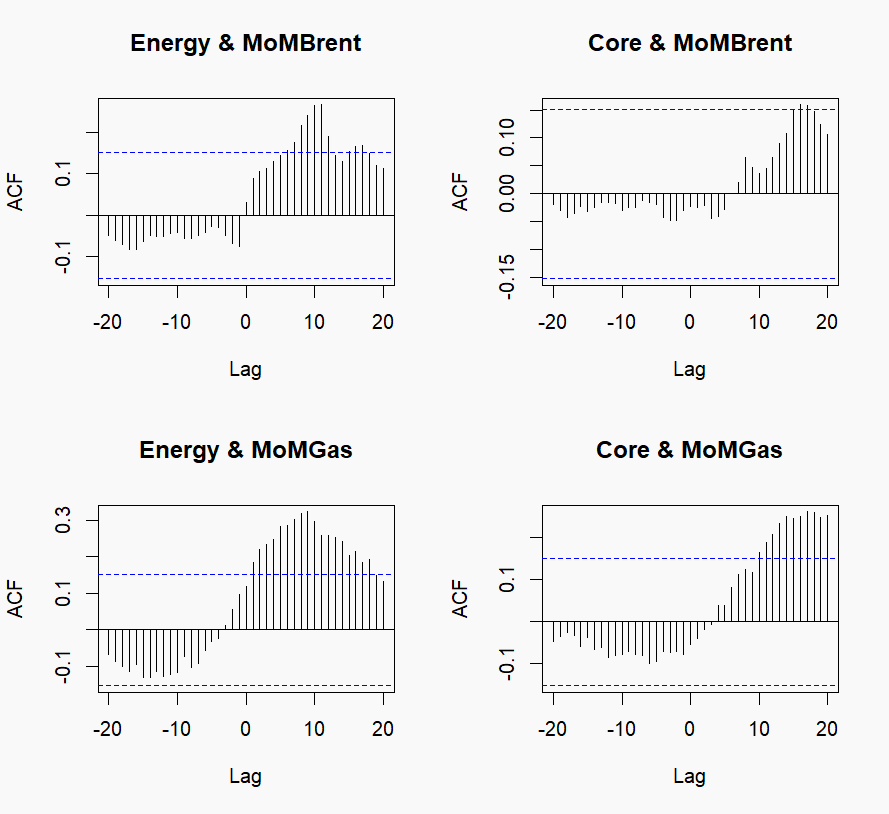
What about underlying inflation? Energy shocks are especially harmful if energy inflation begins seeping into wage-setting and other factors influencing the core of headline inflation. The following figures discuss if increases in oil and gas eventually affect core inflation, given a positive lag (months). As can be seen, energy inflation reaches peak correlation with very little delay. Core inflation’s correlation only becomes pronounced at a later period, and interestingly only statistically significant for gas.
The (as promised) short and sweet analysis reinforces the notion that big shocks have, historically, led to quick and even bigger movements in energy prices. As to what that means for current events, only time will tell.

Leave a comment