
Up, but by how much?
We’ve talked before about the inflationary repercussions from the conflict currently ravaging the world’s energy markets.
At the start of the war, the ECB exceptionally included the latest incoming data to form its March macroeconomic forecasts. It also developed three alternative paths for the indicators, contingent on how the conflict developed. The ‘Mild’, ‘Adverse’, and ‘Severe’ scenarios were updated in the latest June projections.
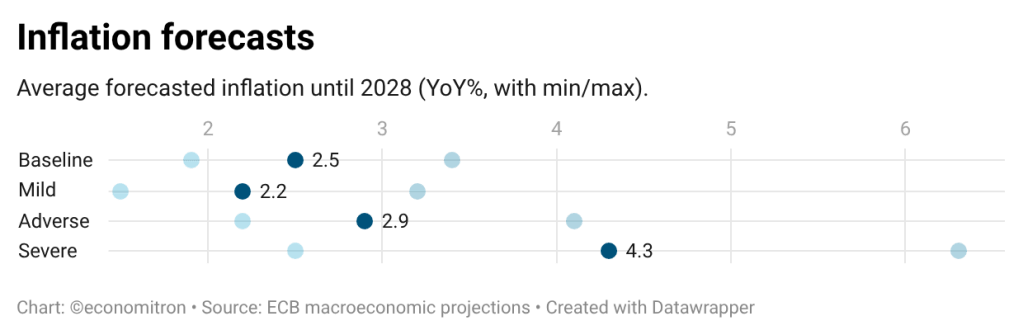
Just days after releasing the initial projections, some Governing Council members were already touting that the baseline scenario was too optimistic. With no end in sight and as the half-year mark is crossed since the energy disruptions began, we can only help but wonder what’s in store for interest rates.
But that won’t stop us from wondering.
The interest rate model developed in the last post provides a neat platform on which to dump these projections. As a quick reminder, it mimics the central bank’s reaction function by considering underlying inflation dynamics, the inflation forecast and monetary transmission to spit out a path for interest rates.
Of course, extrapolation is more difficult than interpolation, so we take some creative solutions. Namely:
- For smoothness, quarterly inflation projections are linearly interpolated into monthly frequency. This is especially tricky for the momentum values of the model, which lose some meaning through the interpolation (defensible but not necessarily robust).
- The inflation forecast component is fundamentally different, as now there’s only one forecast for inflation. As such, it will consider the divergence of each period’s forecast from both the target and the baseline projection. The latter helps assign more weight to the inflation outlook pillar when the scenario is severe.
The result of the work is shown below. It shows the state-contingent paths for the policy rate, given a parametrisation that results in the closest fit between actual and model-implied rates before the forecast.
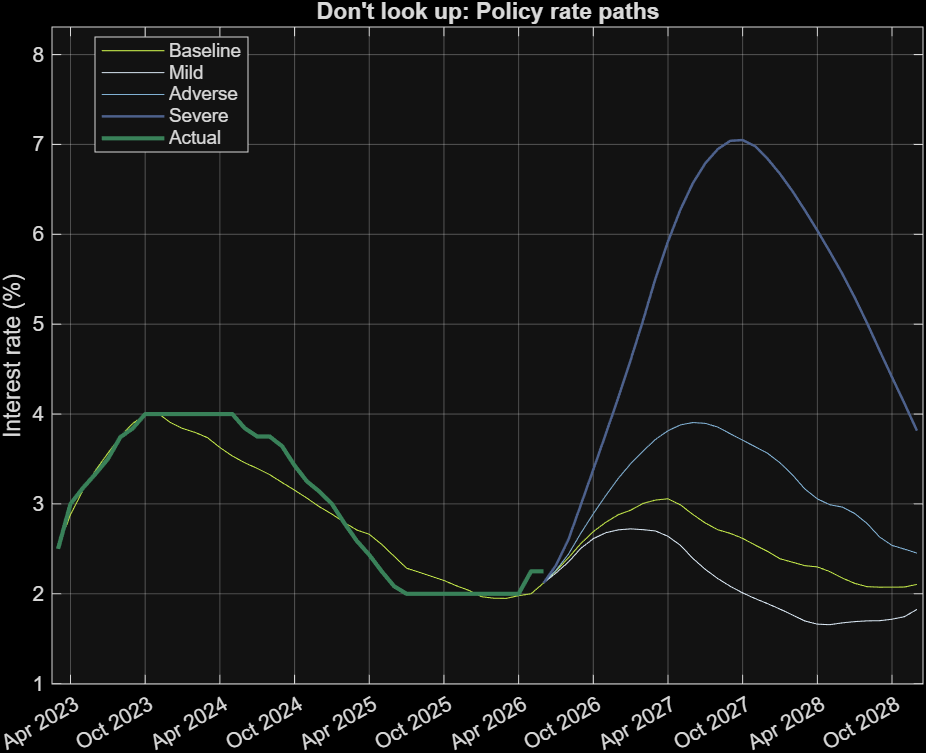
First, the cool stuff. As expected, more severe scenarios lead to more forceful interest rate hikes. Interest rates are shown peaking at 3%, 4% and 7% for the baseline, adverse and severe scenarios respectively. All paths are consistent in there being rate hikes in the short term, with the mild scenario predicting only three hikes before stabilisation. It also features the most realistic-looking path, embedding the holding phase that other scenarios exclude.
This is a problem for the other interest rate paths. They all begin cutting too abruptly, which is evident from the pre-projection path as well. At this stage, a weakness in the model thus seems to be that the reaction function is too reactive, not taking any ‘wait-and-see’ into consideration. Although this could easily be artificially introduced into the equations, to do so properly would mean to attach valid economic intuition behind any additions to the equations.
There’s also a conceptual clarification. The ECB’s macroeconomic projections already employ a market-implied path for interest rates, as these are clearly relevant for future inflation values. Indeed, the baseline projections for inflation already embed ca. 3 interest rate hikes. This becomes more difficult to interpret in more severe scenarios.
Here, the inflation path is taken from an external source, whilst the interest rate responds to those shocks endogenously. These responses do not feed back into inflation values. Therefore, the outcomes charted on the figure are representative of policymakers’ reactions to adverse inflation shocks. In other words, it’s a reaction function to a given exogenously imposed inflation path.
So, to answer the title’s question: up. ‘By how much’ depends on which scenario we end up landing on. This analysis has provided an indicative answer to the second question through the use of a reaction-function model. Only time will tell which path we take—and how wrong we are.
 Economitron
Leave a comment